
Products / Analytics
See where
the week went.
Labour cost and hours, rostered against worked, store by store and against the last period, from the roster and timesheets you already use.
How it would work across your venues.
A normal week running three venues, with the numbers in front of you as you go.
- Monday morning
Every venue’s week, side by side.
Open the rosters for all your venues on one screen. You see each venue’s hours and wages for the week and whether its roster is published, then open any venue when it needs you.
- Hours and wages for each venue
- Published or still a draft, at a glance
- Open any venue in one click
- Away from your desk
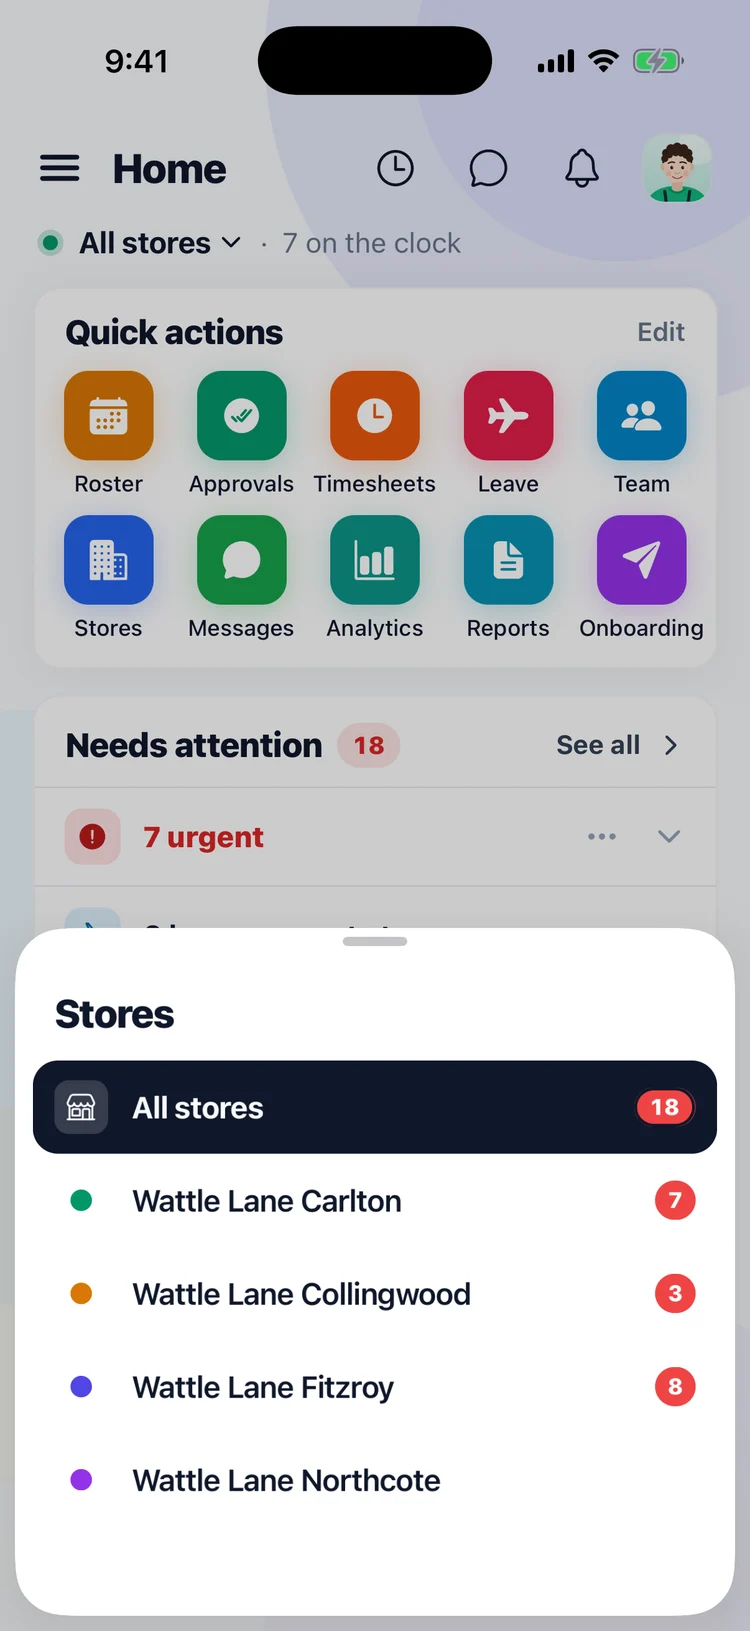
Every venue, one tap away.
In the Orbit Operations app, the store menu lists every venue with how many things need you at each. Pick one to see just that venue, or All stores to see them together.
- Every venue in one menu
- What needs you at each
- One venue or all of them
- Before you publish
Labour against your forecast, day by day.
Enter your sales forecast and the roster does the maths. Each day shows its wage cost and labour as a share of your forecast, so a heavy Wednesday stands out before your team sees the roster.
- Your sales forecast beside the week’s wages
- Labour as a share of the forecast, each day
- The whole week’s cost before you publish
- As the week runs
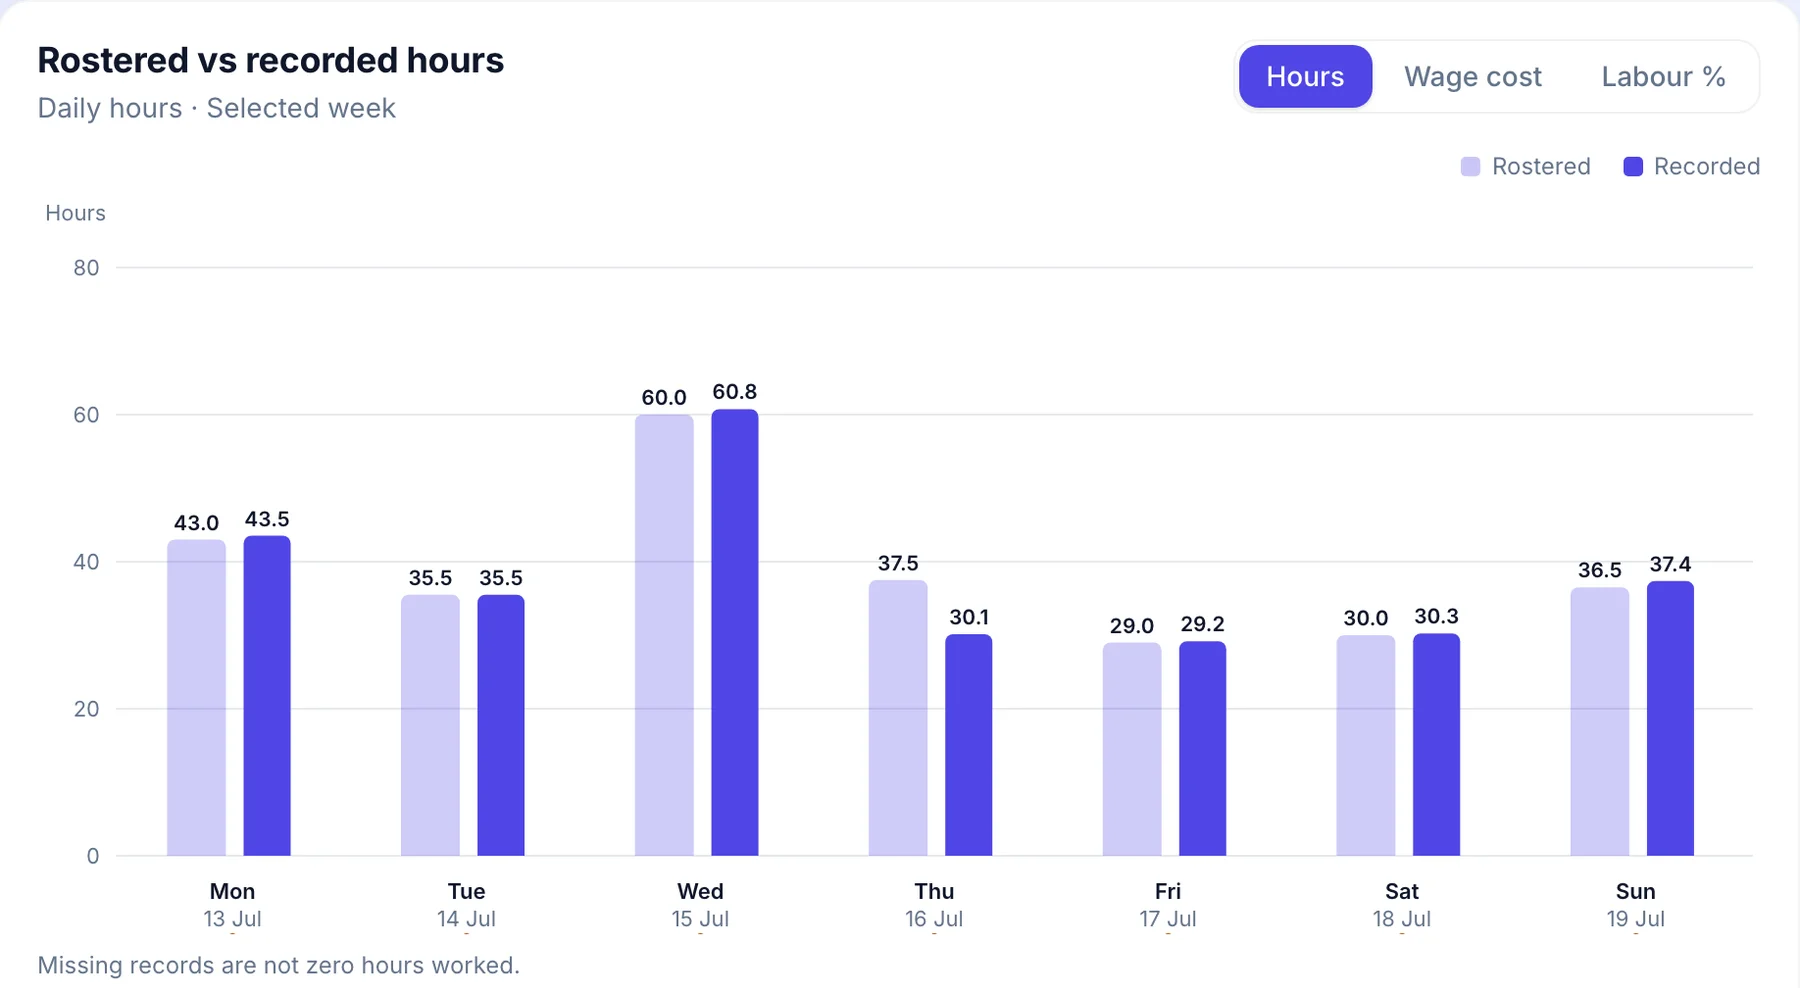
Rostered against worked.
Every clock-in lands against its shift, so the hours your team actually works sit beside the hours you rostered. A day that ran long shows up while you can still do something about it.
- Rostered and worked hours, day by day
- Switch between hours, wage cost and labour %
- Every venue together, or one at a time
- End of the week
Venue against venue.
See every venue’s week next to the others: the sales you reported, paid hours and how many shifts started on time, each against its own week before.
- Sales you report, venue by venue
- Paid hours and on-time starts
- Compared with the week before
- Who sees the numbers
Your managers see their venue. You see them all.
Owners see every venue and every figure. A store manager works with the venue they run, and you decide whether they can see wages and labour costs.
- Owners see every venue
- Managers see the venue they run
- You choose who sees dollar figures
What it does.
Overview, labour and attendance, compared with the previous period.
Rostered or approved, per store and per week.
Labour as a share of sales, wherever you have sales figures.
Late starts and missed clock-ins, shift by shift.
Late starts, missing clock-outs and what’s waiting on you, in one list.
Filled in on the app with photos, reviewed on the web.
The whole business for you. Their store for managers.
Owners see every store and compare them. Managers see their own store. Wages and sales are shown only to roles allowed to see them.
Who can see wages and sales is set by role.
Questions people ask.
- Where do sales figures come from?
- From the sales forecast you enter, or the sales reports you upload or email in.
- Are the labour figures exact?
- Rostered figures are estimates. Approved figures come from approved timesheets. Estimates are always marked as estimates.
- Can managers see sales and wages?
- Only if their role allows it. The owner decides.
Analytics comes with Orbit’s core platform: $7.50 per person a month, everything included. Add or remove people any time.
See pricingSee where the week went.
Labour and attendance for every store, in one place.